May 10, 2026 · LivingHockey
Corsi vs. Fenwick: What They Are and Which One Is Actually Better
Corsi and Fenwick are two of hockey's most-cited possession stats. Here is what each one measures, how they differ, and which one is actually better.

Watch a hockey broadcast or read a postgame analysis these days and you'll run into the same two words: Corsi and Fenwick. They sound like law firms. They are actually two of the most useful stats in hockey, and they are easier to understand than most people make them out to be.
This is the no-nonsense version. What they are, what makes them different, and which one is actually better.
What Corsi Measures
Corsi counts shot attempts. All of them.
Imagine you're at a hockey game with a clicker. Every time a player on Team A tries to shoot the puck at Team B's net, you click. It doesn't matter what happens to the shot. You click for shots that go in. You click for shots that the goalie saves. You click for shots that miss the net. You click for shots that get blocked by a defender. Click, click, click.
At the end of the game, you compare the clicks. Team A had 60 shot attempts. Team B had 40. Team A's "Corsi" was higher. We say Team A had 60% Corsi, meaning they took 60% of the shot attempts in the game.
That's the whole stat. It's a count of who tried to shoot more.
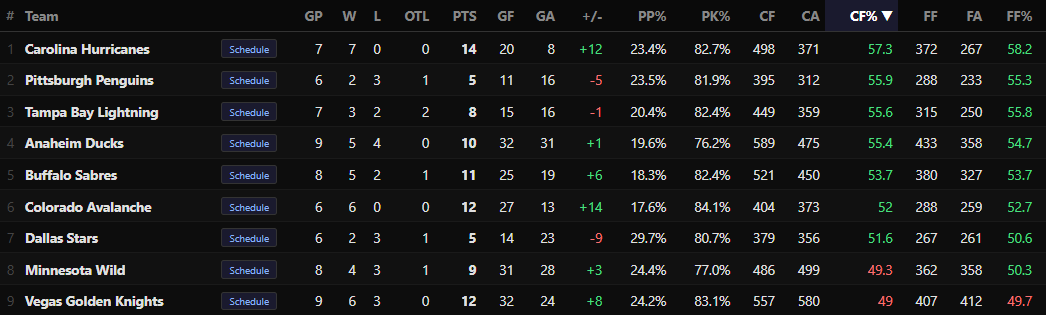
The reason this matters is simple: in hockey, you can't shoot the puck if you don't have the puck. So a team that takes more shot attempts almost always had the puck more. Corsi is, at heart, a stand-in for possession. It tells you who controlled the play, even when the score doesn't reflect it. For instance, the Carolina Hurricanes lead this year's playoffs in 5v5 Corsi at over 60%, which is part of why their early dominance has felt structural rather than lucky.
You can see Corsi for individual players too. If a player is on the ice for 30 of his team's shot attempts and only 20 of the other team's shot attempts, his individual Corsi is 60%. He helped his team control play whenever he was out there.
What Fenwick Measures
Fenwick counts shot attempts too, but with one difference: it ignores blocked shots.
So if Team A took 60 shot attempts and 10 of them were blocked by Team B's defenders, Team A's Fenwick is 50, not 60. We're only counting shots that either reached the net (goals plus saves) or missed the net entirely. Anything that hit a defender's leg before getting through doesn't count.
Why exclude blocked shots? Because blocking a shot is a skill. Some teams and some players are very good at it. The thinking is that a blocked shot represents the defending team doing something right, so it shouldn't be credited to the shooting team's offense.
That's the only difference. Corsi counts everything. Fenwick excludes blocks. Both are still measuring the same general thing: who is trying to shoot more, and therefore who has the puck more.
So Which One Is Better?
Here's the honest answer: Fenwick is slightly better at predicting which teams will be good over a full season.
Multiple studies have shown that across a full 82-game schedule, Fenwick has a marginally stronger relationship with how many points a team finishes with than Corsi does. The reasoning makes sense: by stripping out blocked shots, Fenwick filters out a noisy element and gets closer to "real" possession.
But that's not the full story.
Over smaller samples, like 10 or 20 games, Corsi is more useful. Because it counts more events (every blocked shot is one extra data point), it stabilizes faster. If you want to evaluate how a team has played in their first 15 games of the season, Corsi gives you a more reliable read than Fenwick does. There simply aren't enough Fenwick events yet for the number to mean much.
So the practical answer most analysts use:
For short-term evaluation (early season, recent stretches, individual series): use Corsi.
For full-season evaluation and predicting next year: use Fenwick.
For most everyday conversations: it doesn't matter that much. The two stats are highly correlated, and a team with a bad Corsi almost always has a bad Fenwick too.
You can see both numbers for every team and every player on our Player Stats and Team Stats pages, along with definitions in our Glossary.
A Word of Caution
Corsi and Fenwick are good. They are not perfect.
The biggest weakness of both stats is that they treat all shot attempts as equal. A 60-foot wrist shot from the boards counts the same as a one-timer from the slot. Anyone who has watched hockey knows those are not the same shot.
That's why hockey analytics has, over the last decade, increasingly moved toward stats that account for shot quality. The most important of these is Expected Goals, or xG, which weighs each shot attempt based on how likely it was to actually become a goal. We'll cover xG in a separate post, because it deserves one. But for now, just know that Corsi and Fenwick are the foundation. xG is the building you put on top of that foundation.
The Bottom Line
Corsi counts shot attempts. Fenwick does the same thing but ignores blocks. Fenwick is a slightly better predictor over a full season; Corsi is more useful in smaller samples because it has more data.
Either way, both stats are trying to answer the same question: who had the puck more, and is that team likely to keep winning? The answer to that question, more often than not, is yes.
More analysis on LivingHockey News.